Using the Gantt Chart
One of the most salient features of the Activity Map is the Gantt Chart which presents a color coded, horizontal bar chart. Each color represents a different activity level for easy identification in planning, coordinating and tracking tasks within an Integration.
Opening and Working with the Gantt Chart
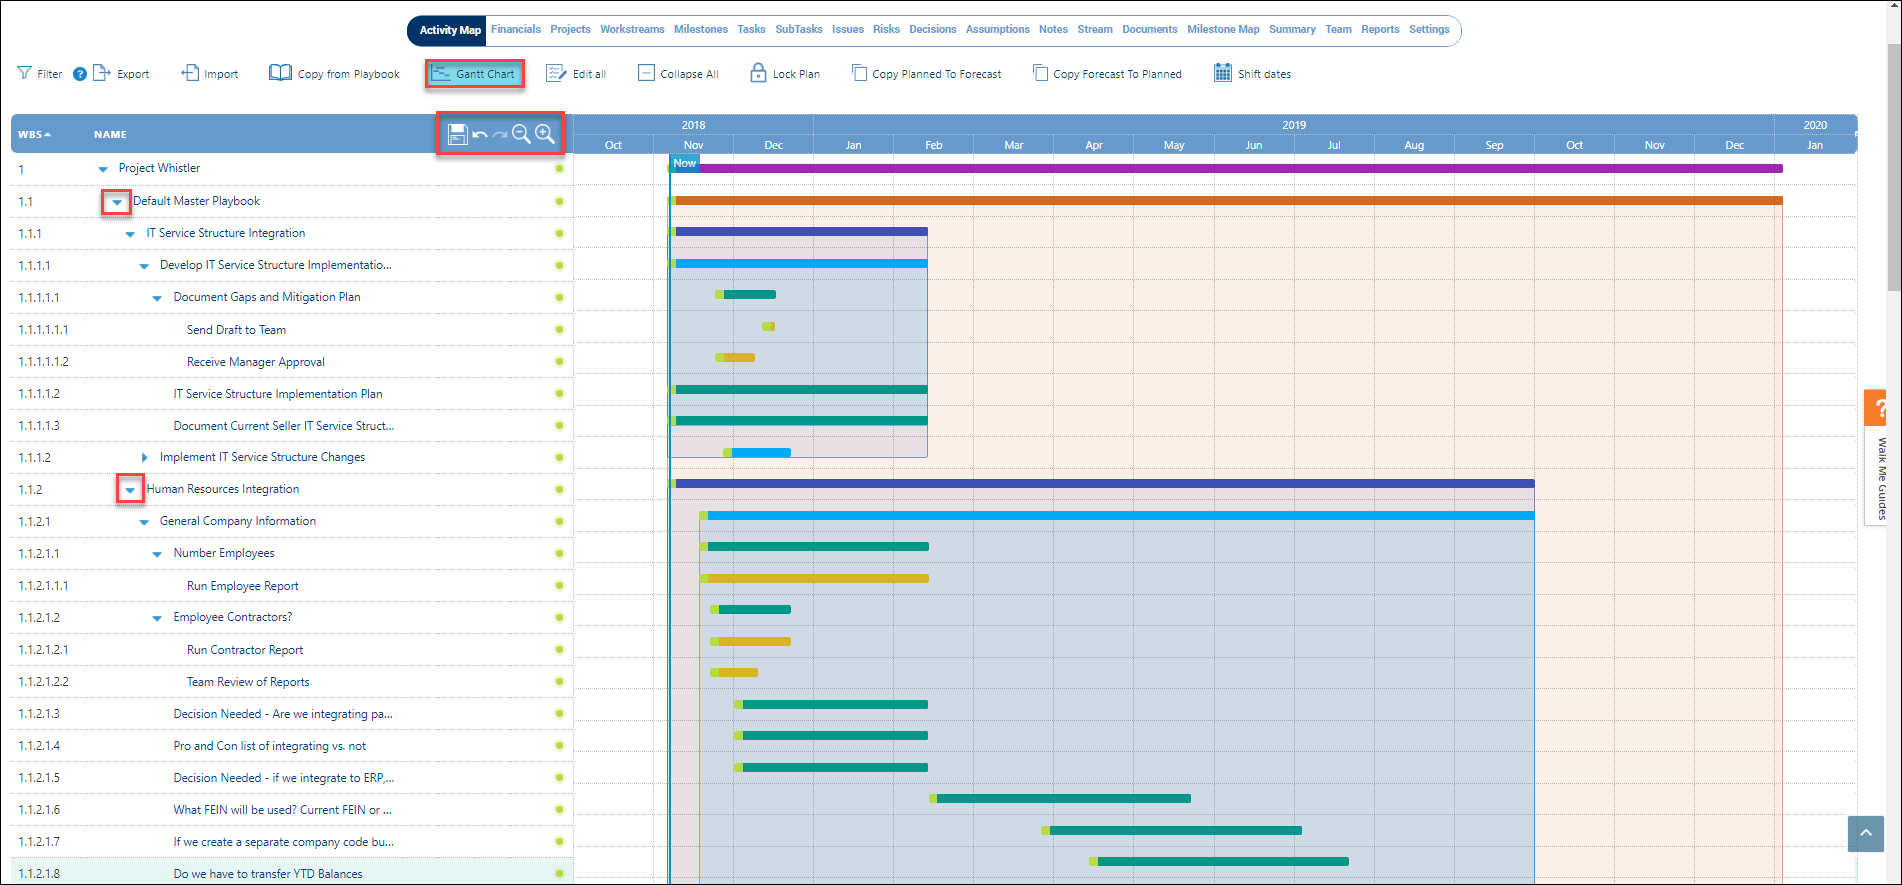
To view the interactive Gantt chart, click on the Gantt Chart button and you will be presented with the following color-coded chart. Each bar color represents a different activity level for easy identification. To view the lower level activities, click on the blue triangle to the left of the activity name. Sub-activities are displayed in a shaded box under the parent to help visualize the parent-child relationship.
Purple - Integration level
Orange - Project level
Dark Blue - Workstream level
Sky Blue - Milestone level
Green - Task level
Brown - Subtask level
Viewing and Navigating the Gantt Chart
You are able to adjust the zoom level of the Gantt chart by clicking the — or + buttons at the top of the chart. Each time you click the + you will drill into (zoom in) the schedule and each time you click the — you will drill out (zoom out). This is useful for viewing and modifying short or long duration activities that are difficult to visualize at a single zoom level. The zoom levels are Quarter, Month, Week, and Day.
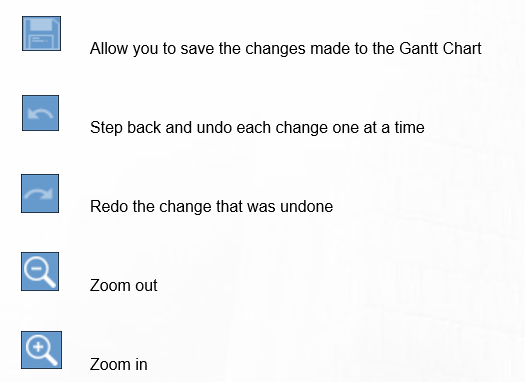
The buttons on the Gantt Chart perform the following actions:
Working in the Gantt Chart
Changing Start/End Dates
To change the start or end date of an Activity, place the mouse cursor over the desired bar and when the arrow changes to a 4 sided, plus sign arrow, hold down the left mouse button and drag the front or end of the bar left or right to change the date. A little pop-up window will appear as you change the date to show by how many days you are moving the activity and the new start or end date. When you release the mouse button the display will momentarily update to automatically calculate the new schedule status. If you are not happy with the change you can click the Undo icon at the top of the chart.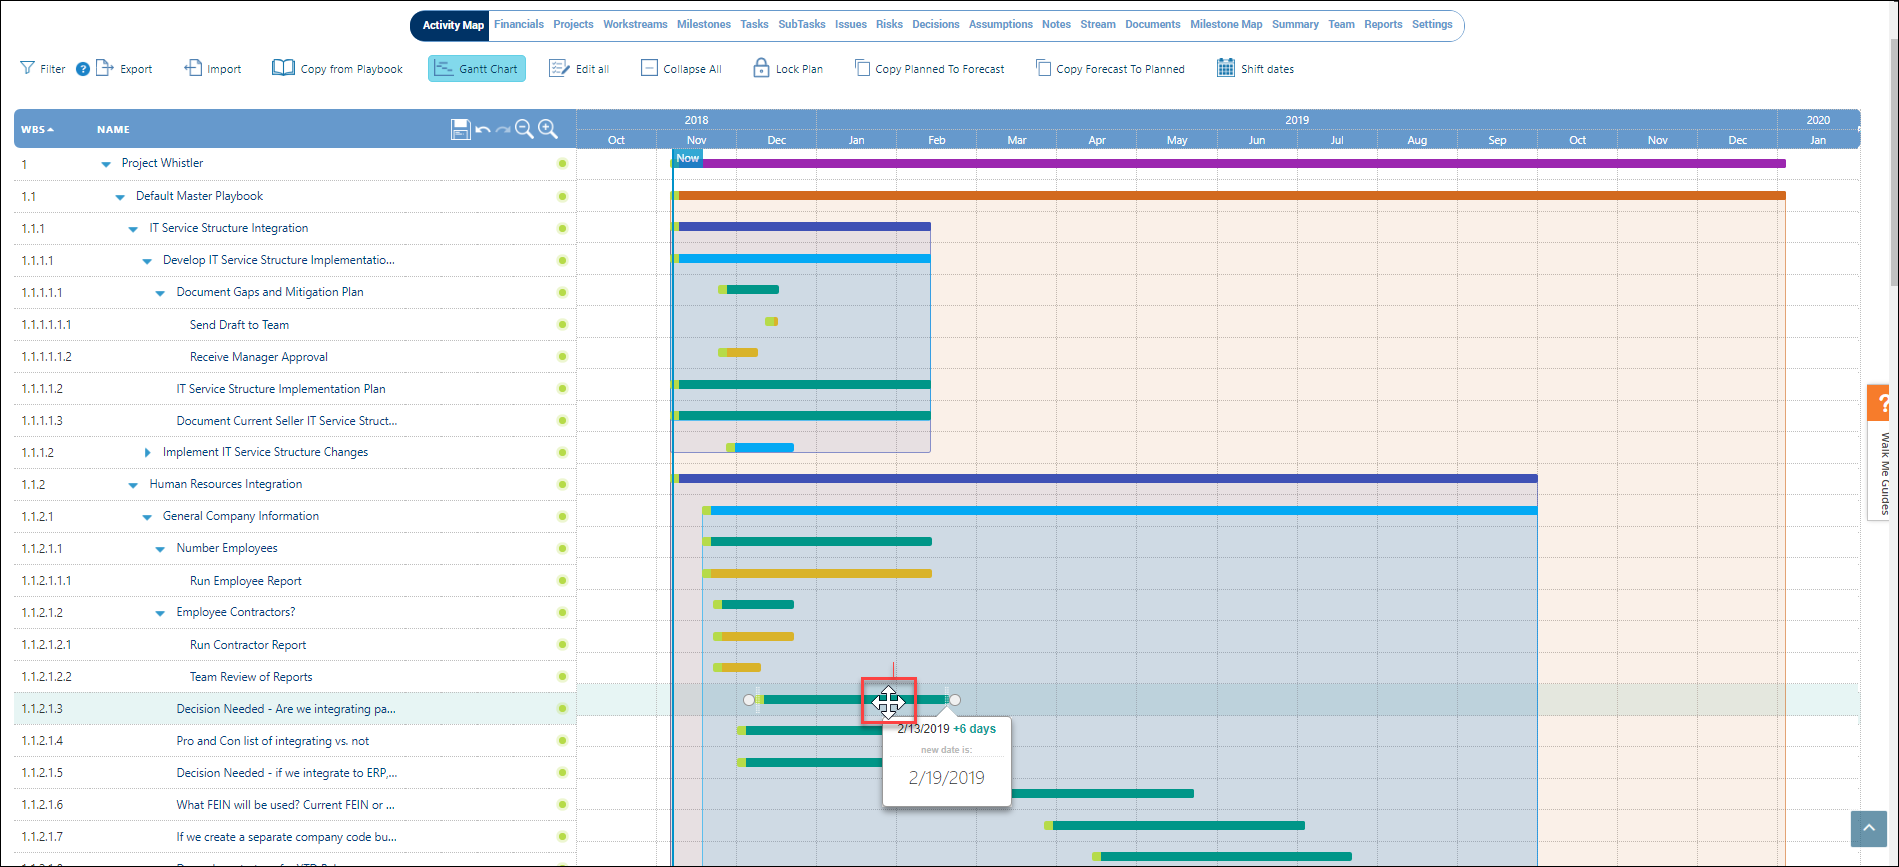
If you double-click on a bar...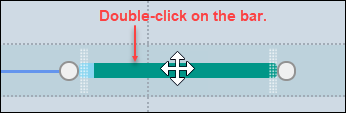
A pop-up window will appear to adjust dates and owners.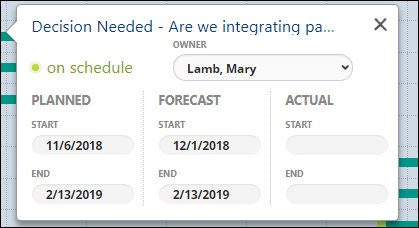
Saving the Gantt Chart
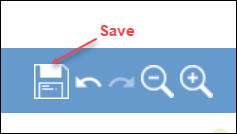
As you update the Gantt chart it's important to ALWAYS save your changes by selecting the Save icon located at the top of the Gantt chart.
Exiting the Gantt Chart
When you are done editing the Gantt chart, save your work and select the Gantt chart icon to close and return to the Activity Map.
