Using the Gantt Chart
One of the most salient features of the Activity Map is the Gantt Chart which allows users to draw dependencies between the three (3) lower Activity levels - Level 4, 5, and 6, typically known as Milestone, Task, and SubTask.
The Gantt chart is extremely interactive and allows you to easily adjust the project plan.
Opening and Working with the Gantt Chart
To view the Gantt chart:
- Navigate to the Activity Map.
- Click on the Gantt Chart button.
- The Gantt Chart is displayed to the right of the Activity Map with bar colors representing the different Activity Levels. To view the lower-level activities, click on the blue triangle to the left of the activity name.
Purple - Target level
Orange - Project level
Aqua Green - Workstream level
Sky Blue - Milestone level
Green - Task level
Mustard Yellow - SubTask level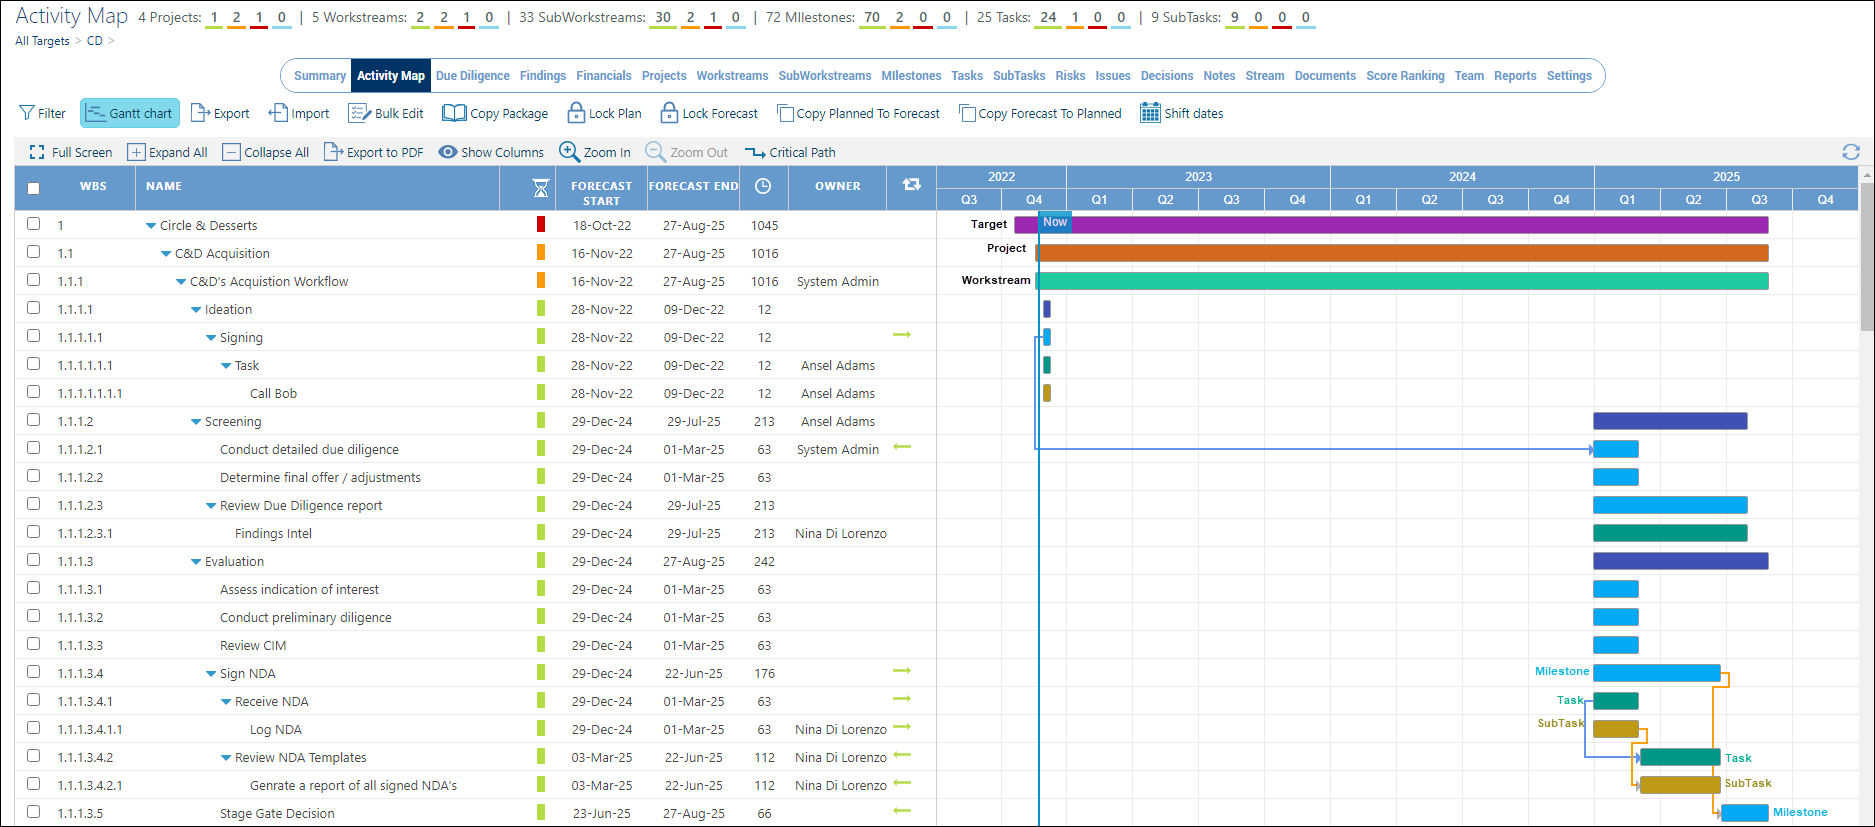
Viewing and Navigating the Gantt Chart
Users are able to adjust the zoom level of the Gantt chart by clicking the Zoom in or Zoom out buttons at the top of the chart. Each time a user clicks on the +, they will drill into (zoom in) the schedule and each time the — is pressed, the user will drill out (zoom out) of the schedule. This is useful for viewing and modifying short or long-duration activities that are difficult to visualize at a single zoom level. The zoom levels are Quarter, Month, Week, and Day.
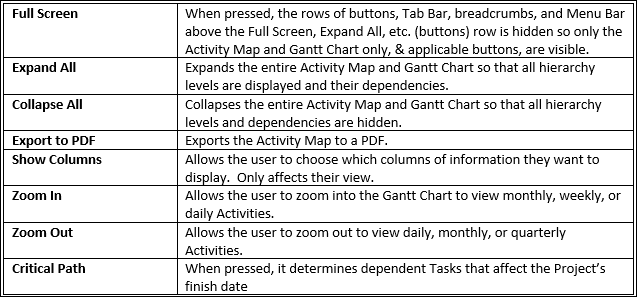
The buttons on the Gantt Chart perform the following actions:

Working in the Gantt Chart
Changing Start/End Dates
To change the start or end date of an Activity:
- Place the mouse cursor over any part of the bar, left-click and hold down the mouse button. When you drag the bar, the arrow changes to a 4-sided, plus sign arrow. Continue to drag the bar left or right. The Forecast Start and Forecast End dates will adjust.
- Point the mouse between the circle and edge (left or right) of the bar. When the mouse changes to a double-headed arrow, drag the front or end of the bar left or right to change the date.
In either method, a pop-up window will appear as you change the date to show how many days you are moving the activity and the new start or end date. When you release the mouse button the display will momentarily update to automatically calculate the new schedule status.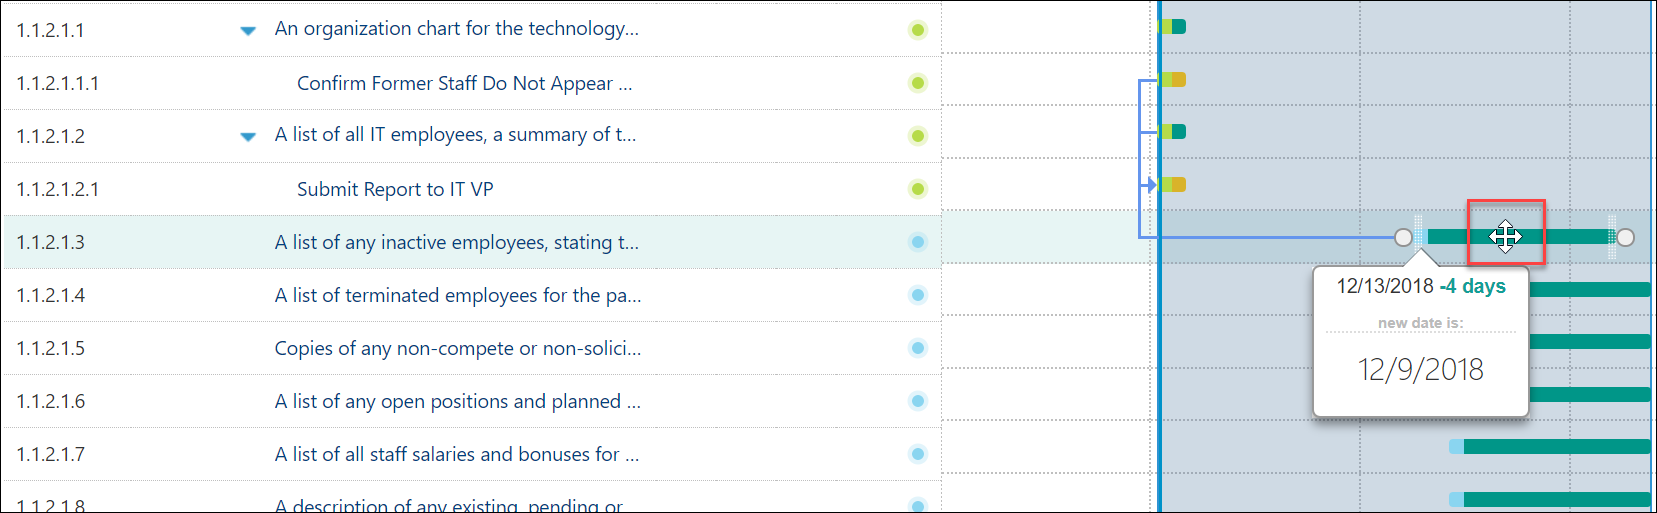
Saving the Gantt Chart
The Gantt Chart automatically saves your changes.
Exiting the Gantt Chart
When you are done editing the Gantt chart select the Gantt chart icon to close and return to the Activity Map.
