Program Dashboard Overview
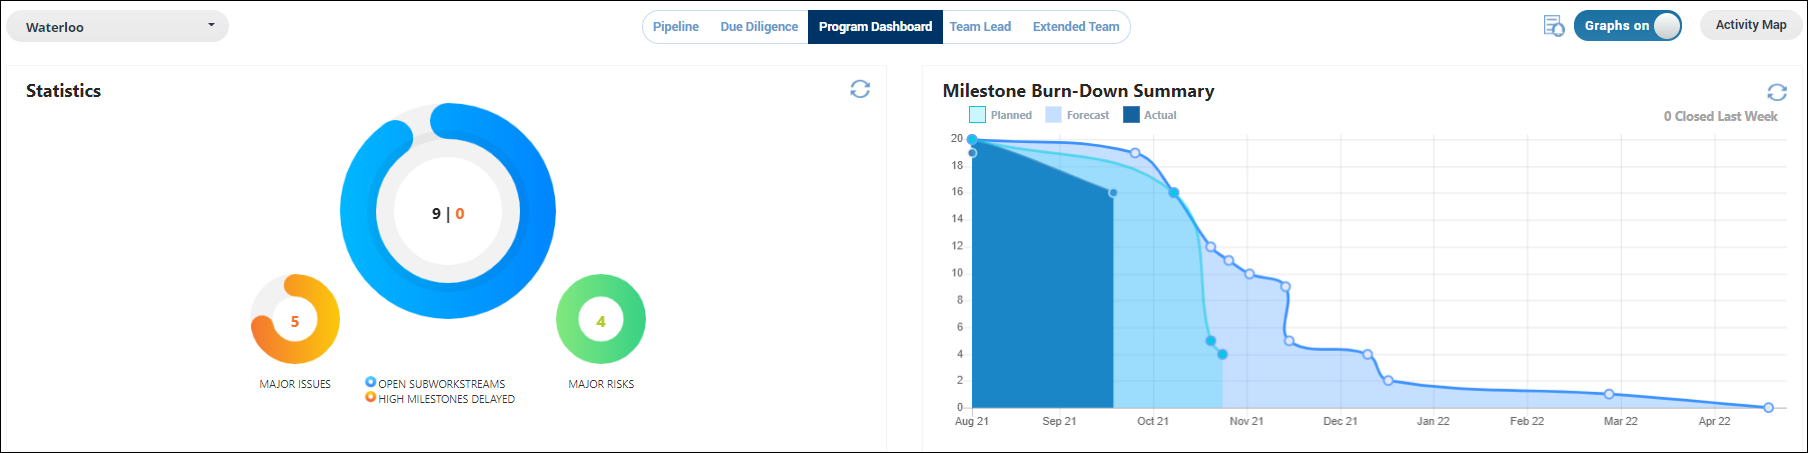
The Program Dashboard displays high-level key Integration data ranging from SubWorkstream, Risks and Issues statistics to Milestone Burn-Down Summary along with an overview of several hierarchical levels, e.g. Activity Levels 1 - 3. A description of these areas is described below.
Statistics - captures the number of major Issues and Risks, open SubWorkstreams, and delayed Milestones.
Milestone Burn-Down Summary - displays the number of Milestones based on the following dates:
Planned - baseline dates established at the start of the project and do not change.
Forecast - an estimated date
Actual - Milestones that have started and completed.
Projects - captures the Project's name, Owner, Forecast End Date, Workstreams, SubWorkstreams, % Complete, Criticality, and Status of the Project.
Workstreams Overview - captures the Workstream's name, Owner, Forecast End Date, SubWorkstreams, Milestones, % Complete, Criticality, and Status of the Workstream.
SubWorkstreams Overview - captures the SubWorkstream's name, Owner, Forecast End Date, SubWorkstreams, Milestones, % Complete, Criticality, and Status of the SubWorkstream.
Major Issues - displays the major Issues within the Integration.
Major Risks - displays the major Risks within the Integration.
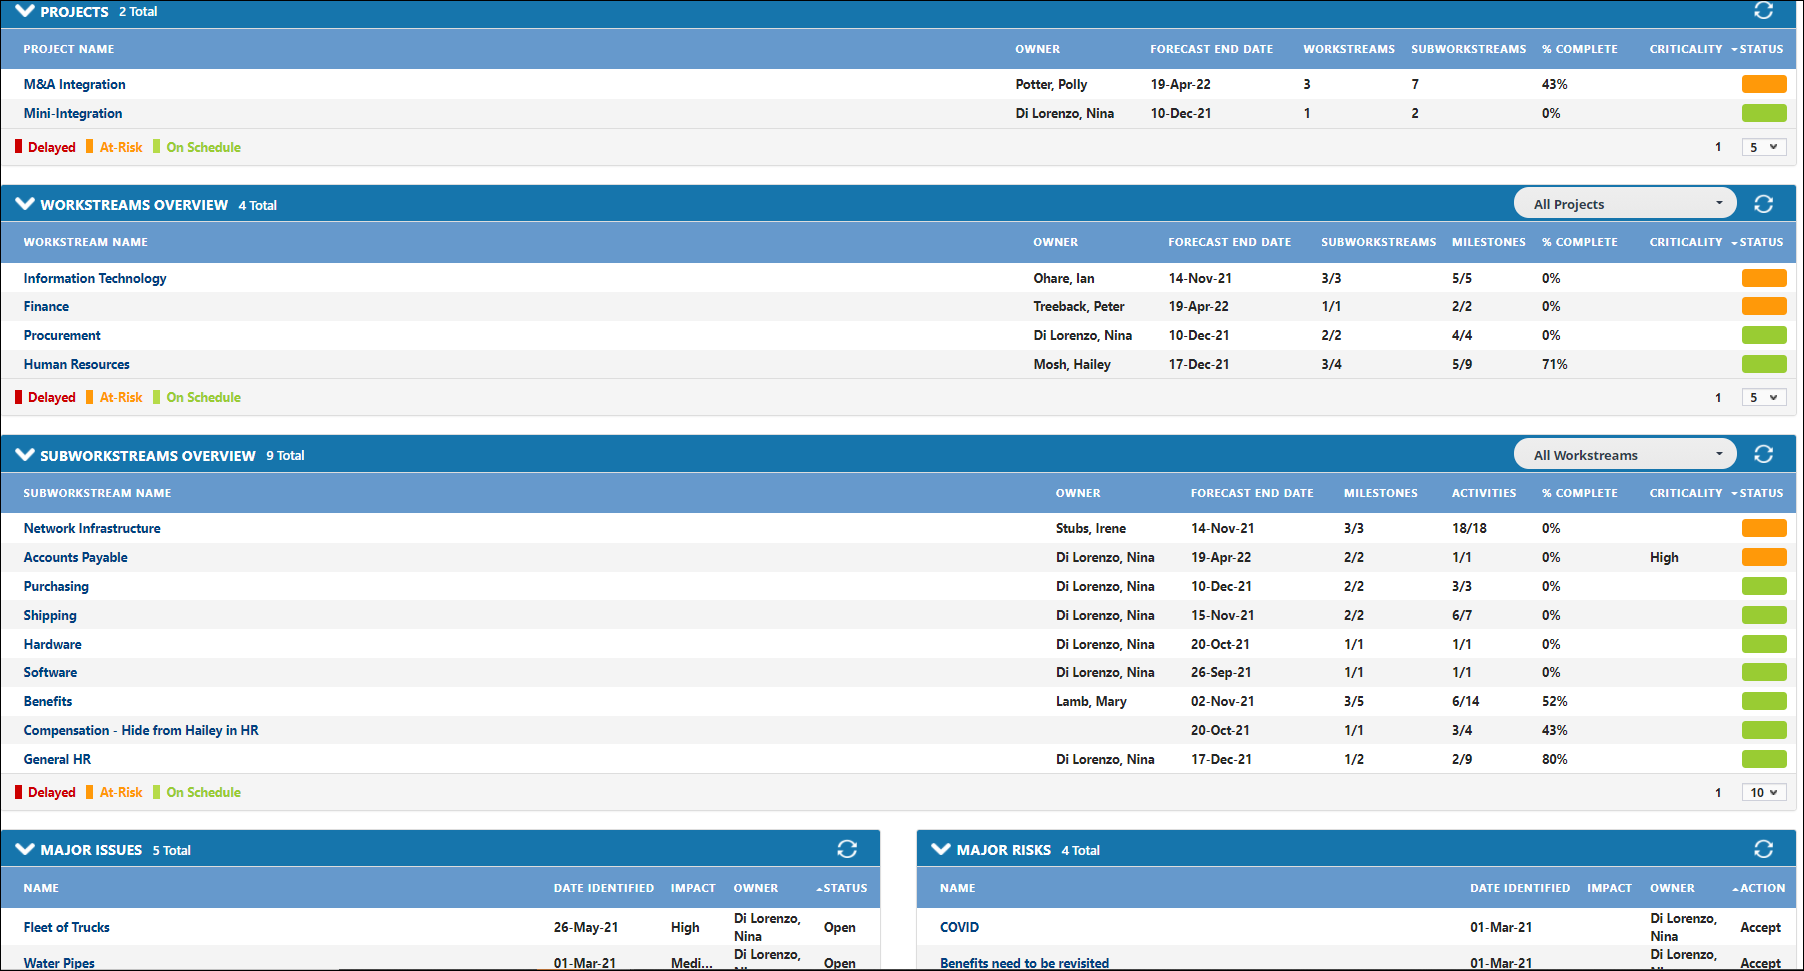
Each section can be expanded or collapsed by selecting the down arrow of the numerical value within the Status column.
